Usage
- home Home
- book Usage Guide
- quiz FAQ
- copyright Legal Information
- file_save Download Session Data
On the main page at panel counter_1 users have three options to start a PTMVision session:
To start a new PTMVision session, two mandatory inputs are
necessary: To make a selection in the Input Format drop-down
menu and to upload a file in the respective format in the
PTM Data file upload. The former conveys the data format to be
expected, while the uploaded file contains the actual PTM data. The
content size to be uploaded is currently limited to 50 MB (after
compression). If the file size exceeds this limit, the upload will fail
with a 413 status code.
In addition to search engine-specific formats, the mandatory Input Format drop-down menu allows users to select
The following table provides an overview of the supported search engine specific formats that are currently available to be uploaded to PTMVision.
| Search Engine | Version Tested | Columns Used | Postprocessing Applied by PTMVision |
|---|---|---|---|
| ionbot | v0.10.0, v0.11.0 |
uniprot_id, unexpected_modification, position | |
| MSFragger (via FragPipe with PTMShepherd) |
MSFragger v4.0,
PTMShepherd v2.0.6
|
Modified Peptide, Peptide, Protein ID, Assigned Modifications, Observed Modifications, MSFragger Localization, Protein Start | Filter ambiguous localisations; Filter ambiguous modifications; Filter combinations of modifications; Map mass shifts and UniMod descriptions to UniMod IDs; Map PTM position onto protein; Retrieve UniMod classification; **. |
| Sage | v0.13.1 |
* | 1% FDR filtering (PSM level); Remove decoys; Remove peptides matching to more than one protein; Map mass shifts to UniMod IDs; Map PTM position onto protein; Mass shifts are not localised, only variable mods are used. |
| MaxQuant |
v2.4.13.0
|
* | Remove peptides matching to more than one protein; Map MaxQuant modification names to UniMod names; Map PTM position onto protein. |
| Spectronaut (PTM Site Report) | v9 |
PTM.ProteinId, PTM.SiteLocation, PTM.ModificationTitle, PTM.SiteAA | Modification mass shift and UniMod classification inferred from the UniMod ID (mapped from PTM.ModificationTitle) and the protein sequence. |
* See psm-utils.readthedocs.io/en/v0.6.0/ for details.
** For FragPipe, localisations for unexpected modifications are derived from the "MSFragger Localization" column. This localisation might be only marginally better than the next best site, so caution is advised. As soon as the next MSFragger version is released, which reports localisation scores as well, PTMVision will include a way to filter modifications based on the scores.
The plain CSV format was implemented to provide users the possibility to transfer individually compiled PTM data to PTMVision if no other format can be used. The following table provides an overview of the required columns and their content. In essence, the format provides the description of a modification at one position of a protein per line as comma separated values - thus, one file can contain information on several proteins. If mass_shift or classification are not provided, they are tried to be inferred from the UniMod ID and the protein sequence.
| Column Name | uniprot_id | position | modification_unimod_name | modification_unimod_id | mass_shift(optional) | classification(optional) |
|---|---|---|---|---|---|---|
| Content Description | The UniProt Accession of the protein. | The position of the modification in the protein sequence (1-based index). | The UniMod name of the modification observed on the specified position. | The UniMod ID of the modification observed on the specified position. | The mass shift of the modification in Dalton. This will be inferred from the UniMod ID if not provided. | The UniMod classification of the modification. This will be inferred from the UniMod ID and modified residue if not provided. |
| Example Entry | P04075 | 5 | carbamidomethyl | 4 | 57.021464 | Artefact |
In addition to the mandatory inputs, users can supply two optional inputs via the Exclude UniMod Classes and Mass Shift Tolerance input elements.
The Exclude UniMod Classes input allows users to exclude specific UniMod classes from the analysis. The single classes can be selected from a drop-down menu and will be added as tags in the input field. If no classes are specified, all classes are included in the analysis. The 18 classes provided by UniMod were extended by
The Mass Shift Tolerance input allows users to specify a threshold for the mass shift of modifications in Daltons. Thereby, a step size of 0.001 Da is applied - this is also the default value. This is only relevant for open search data and combines PTMs whose mass shift relative to each other is within the specified tolerance value.
Once a PTMVision session was established, one can download the results
in a binary zlib compressed format by clicking on 'file_save
Download Session Data' in the header menu on the right. If no session
data is yet available, the request will fail with a
404 status code. The downloaded format is not human
readable, but contains all relevant information of your session. The
file can be re-uploaded to re-initialize a session and is also intended
to easily share results with fellow users.
PTMVision provides a variety of example sessions - one for each supported input type with the exception of the Infer option. A table with all available example sessions with a description can be be accessed by clicking on the 'Browse Example Sessions' button on panel counter_1. From there, example sessions can be started with a single click on the individual Start buttons in the table. The PTM Data files used to set up the sessions can be downloaded from the PTMVision Zenodo record zenodo.org/records/13270569. An overview of the available example sessions and their respective data sources is provided below.
| Search Engine or File Format | Version of Search Engine | Search Type of Search Engine | Source Dataset | Note |
|---|---|---|---|---|
| ionbot | v0.11.0 |
Open | PRIDE project PXD000498, LC-MS/MS run of an unenriched Escherichia coli sample. | UniMod classes Artefact and Chemical derivative excluded (via PTMVision). |
| MSFragger | v4.0 |
Open | PRIDE project PXD007740, LC-MS/MS run of a human colorectal cancer sample enriched for phosphorylated peptides using Ti4+-IMAC. | Source file filtered for modified peptides. UniMod classes Artefact and Chemical derivative excluded (via PTMVision). |
| Sage | v0.13.1 |
Closed | PRIDE project PXD000498, LC-MS/MS run of an unenriched Escherichia coli sample. Closed search with carbamidomethylation as fixed; oxidation as variable. | |
| MaxQuant | v2.4.13.0 |
Closed | PRIDE project PXD025088, LC-MS/MS run of an unenriched Escherichia coli sample. Closed search with carbamidomethylation as fixed; oxidation and protein n-terminal acetylation as variable. | Source file filtered for modified peptides. |
| Spectronaut | v9 |
Not specified | MassIVE project MSV000091214, LC-MS/MS run of an succinyl-enriched mouse kidney sample using DC8 and DC12. | |
| Plain | IEEE VIS 2022 Bio+MedVis Challenge dataset comprising modifications of three human proteins and their mouse orthologs. PTM analysis carried out with ionbot (open search). | UniMod classes Artefact and Chemical derivative excluded (via PTMVision). | ||
| mzIdentML | PRIDE project PXD001077, LC-MS/MS of an unenriched Pyrococcus furiosus sample. PTM analysis carried out with MS-GF+ v10024 via SearchGUI v1.18.7. Closed search with carbamidomethylation as fixed; oxidation and phosphorylation as variable. |
After successful data processing, users will be presented with a variety of overview visualizations (see the following subsections) and a tabular overview of all proteins in the data (described in section V. Overview Table and Protein Selection). All overview visualizations have zoom and pan operations, for which the y-axes of those visualizations that display information per modification are linked, and offer a range of user interactions accessible via the buttons at the top right of panel counter_2:
screenshot_monitor Screenshot of the current view of the overview visualizations. The corresponding image file is automatically downloaded in PNG format.
find_replace Reset the zoom level of all overview visualizations to default (zoomed out completely).
ink_marker Highlight a specific PTM of interest. A pop-up window that supports search input prompts you to select a number of modifications to be highlighted. When you confirm the popup, lines are drawn at the respective coordinates of the specified modifications. To remove a highlight, the interaction must be performed without selecting a modification.
swap_vert Sort the Shared PTM sites, Mass Shift and Site Count visualizations either by mass shift or count. By default, the axes are sorted by count. If sorting by mass shift is set, red areas in the Mass Shift visualization will be highlighted to indicate modifications whose mass shift difference is less than the selected threshold.
For each pair of modifications, this visualization shows if both were found on common sites. If there are sites that were modified by both modifications within the data set, the number of sites is displayed with a color gradient, where brighter cells indicate lower numbers of shared sites. Note that the absolute number of shared sites is given and therefore not normalized by the total number of sites for each modification type, meaning that more frequently occuring modifications will have more shared sites by chance.
Mass shifts of each modification type are shown in the Mass Shift Scatter plot. Hovering over a point will display the mass shift in Dalton. Depending on the input file, the mass shift is either parsed directly from the file or retrieved from the UniMod database (monoisotopic mass). Using the swap_vert button at the top right, the visualization can be sorted by mass shift instead of Site Count.
In this sorted view, red bars are displayed to indicate mass shifts that are less far apart than the user-defined tolerance for mass shifts. This is done to flag modifications that might not be resolvable due to the mass accuracy of the mass spectrometer. Note that the detectability is dependent on the mass accuracy of the mass spectrometer used, as well as the precursor mass.
The Site Count bar chart shows the number of sites that were modified by each modification type. Hovering over the bars will display the number of sites, and additionally show you across how many proteins these sites are spreaded.
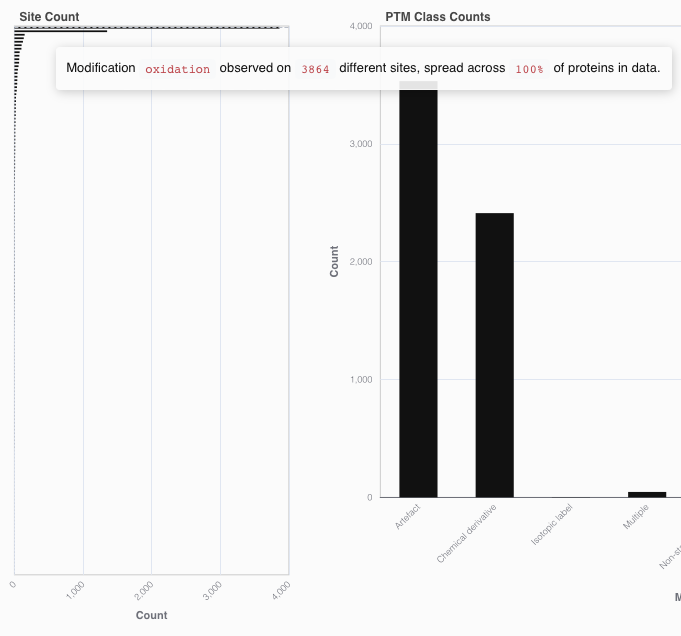
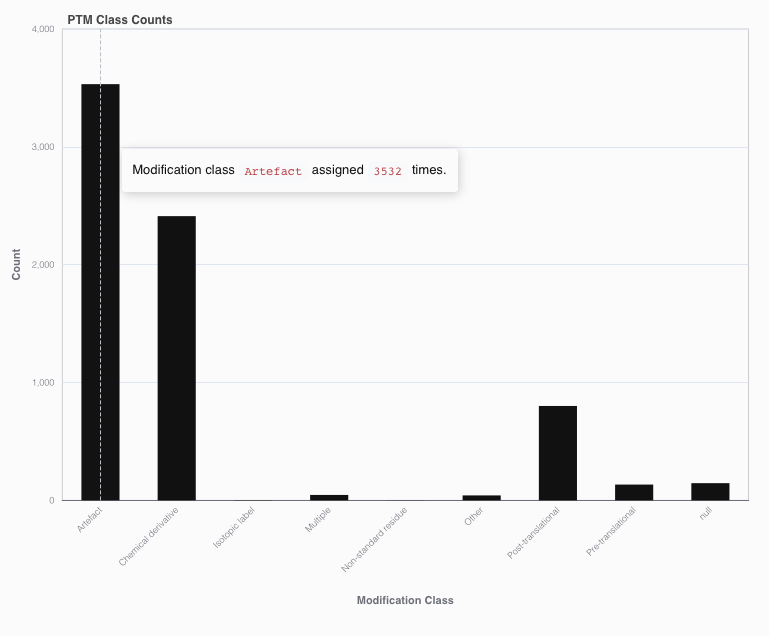
The PTM Class Counts bar chart shows how many times each of the UniMod classes have been assigned to a modification plus site pair. Note that UniMod classifications are depending on the residue that is modified. Hovering over the bars will display the exact number of modifications.
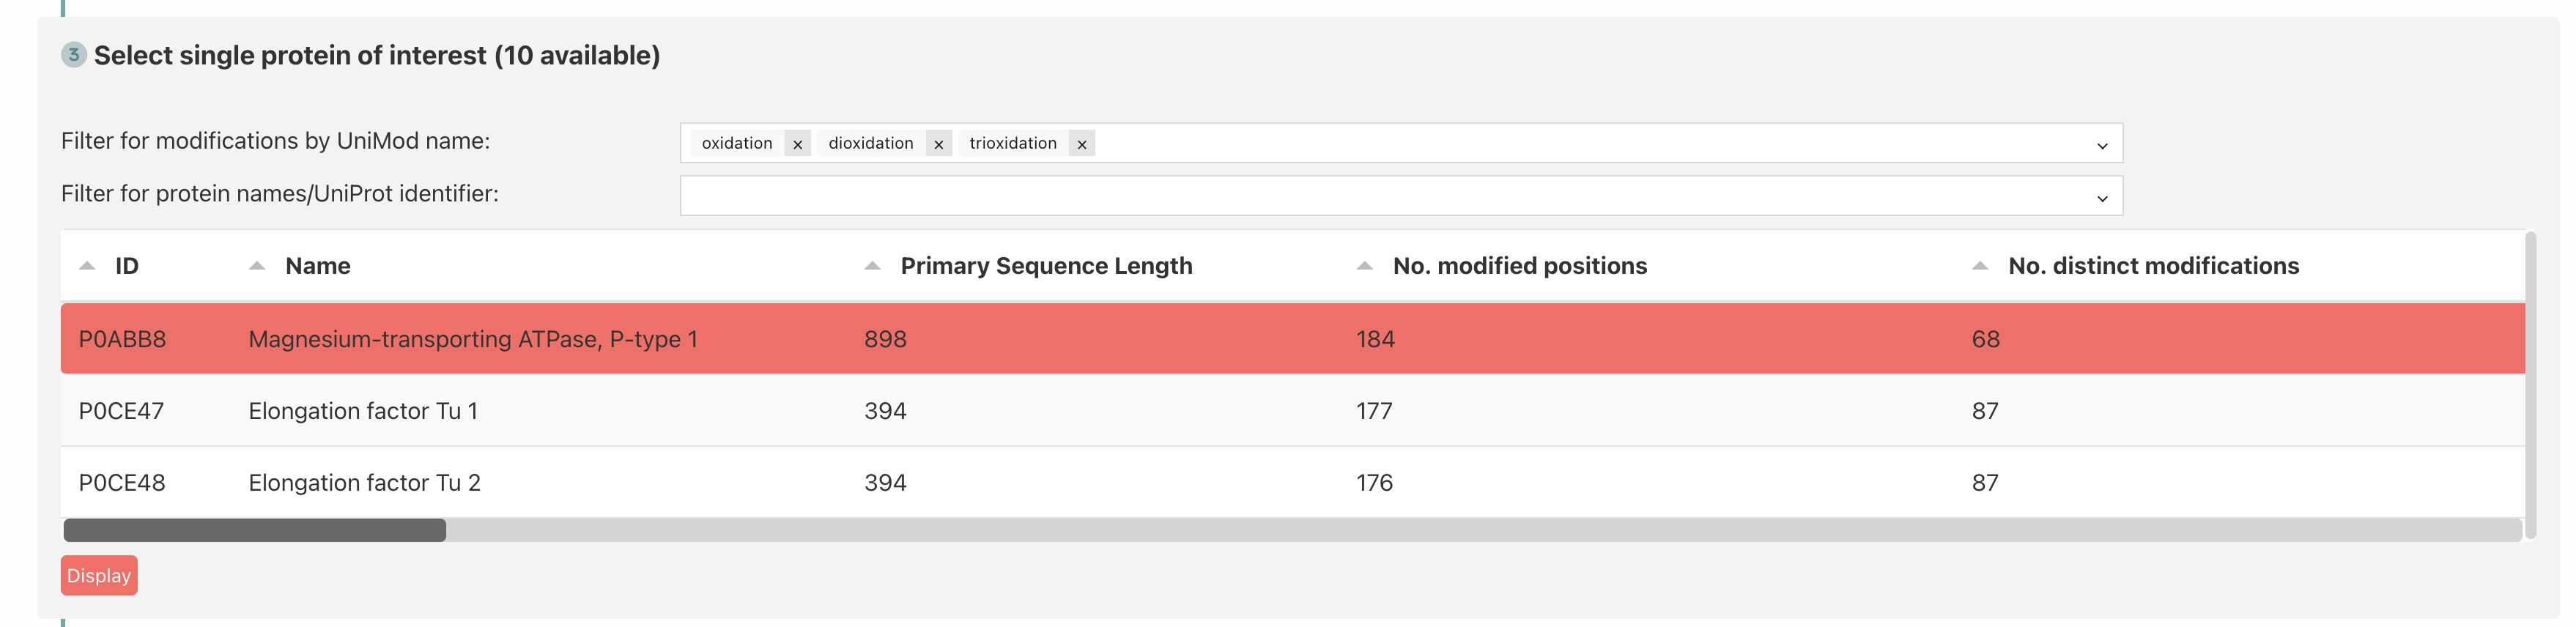
The overview table displays all proteins present in the data set (one per row) after successful processing. In addition to the UniProt primary accession identifier and name matched from UniProt, the number of positions with at least one PTM and the number of different PTMs are displayed. The table can be sorted by all columns in ascending or descending order by clicking on their headers. The two input elements at the top allow the filtering of the rows for the occurrence of PTMs and/or protein UniProt ID or name. For the former, items representing the available PTMs in the data can be selected from a drop-down menu and only those proteins are displayed for which the corresponding PTM was detected.
The table allows the selection of a single protein by clicking on the respective row; This is indicated by red highlighting. After selection, the Detail Visualizations for the corresponding protein can be loaded by clicking on the Display button.
PTMVision offers two distinct modes to display the PTM landscape of a single protein; The Modifications View (default) and the Structure View. Both are rendered in panel counter_4 and are compiled as soon as a single protein is selected for detailed reporting (see section five). The currently selected protein (primary accession, name and source organism) is indicated in the header of panel counter_4 and can be clicked to retrieve UniProt comments for the protein. Furthermore, a range of user interactions is accessible via the buttons at the top right of panel counter_4.
screenshot_monitor
Screenshot of the current view of
the detail visualizations. The corresponding image file is automatically
downloaded in png format.
find_replace Reset the zoom level of all visualizations to default (zoomed out completely).
ink_marker Highlight a specific PTM of interest. A pop-up window that supports search input prompts you to select a number of modifications to be highlighted. To remove a highlight, the interaction must be performed without selecting a modification. For the Modifications View, highlighting is applied in the same way as for the overview visualizations. For the Structure View, highlighting is applied to the protein structure model and those contacts, that comprise the respective PTMs.
screen_rotation_alt Switch between Modifications View and Structure View.
The Modifications View provides an overview over which modification types are found in the previously selected protein and where they are located on the primary sequence. The core visualization is the presence/absence plot, where each row represents a modification type and each column a position in the protein sequence. A filled cell indicates that the modification type was found at the respective position. The cells are colored by the UniMod classification, the color legend is displayed on the top and legend items can be clicked to toggle the display of specific classes. Filtering can be reset by clicking the "Select all" button, the current selection can be inverted via the "Invert selection" button.
The bar chart above the presence/absence plot shows the total number of modifications per position, the distribution of UniMod classes is encoded by colors. Hovering over a bar will show the exact PTM class counts. This bar chart can be used to navigate directly to a site of interest. The bar chart to the far right shows the total number of modification sites per modification type, the distribution of UniMod classes is encoded by colors as well. Hovering over a bar will show the exact PTM class counts. This visualization can be used to navigate directly to a modification of interest.
Tracks below the presence/absence plot show information that could be mapped via UniProt:
The heatmap to the right shows the distribution of modification types across the different amino acid residues. A colored cell indicates that the respective modification type was found on the respective amino acid. The visual map is displayed below the title of the chart, where a darker color indicates a higher number of sites with this modification-amino acid combination. Note that the absolute, non-normalized numbers of sites are given.
Clicking the screen_rotation_alt switch button on the panel menu will open the structure dashboard. The left side shows a protein contact map of the protein structure: The residues are plotted against each other, and a cell is colored if the respective residues are in close contact, meaning that their C-beta (Glycine: C-alpha) atoms are within a distance of 4.69 Angström. The cells are colored according to the modification state of the respective residue pair:
The color legend is displayed at the top and items can be clicked to toggle the display of specific classes. The filtering can be reset via the "Select all" button, the current selection can be inverted via the "Invert selection" button. The bar chart on top and the tracks at the bottom are the same as in the Modifications View: The first shows the total number of modifications per position, the second shows the annotations mapped via UniProt.
Hovering over a cell in the contact map shows additional info on the two residues (PTM class counts, UniProt Annotations). Clicking on a cell will highlight the respective residues in the structure model on the right side, and show their distance in Angström. Highlighting a modification via the ink_marker button will color the residues in the structure model that carry the selected modification in red. The structure model can be rotated by clicking and dragging the mouse, zoomed in and out by scrolling the mouse wheel, and panned by dragging the mouse. Furthermore, details of the modification types observed for the two residues represented by the clicked cell are displayed on the tracks below the structure model, plotted according to their mass shift in Dalton.
If you use this software, please cite it as below:
PTMVision: An Interactive Visualization Webserver for Post-translational Modifications of Proteins
Simon Hackl, Caroline Jachmann, Mathias Witte Paz, Theresa Anisja Harbig, Lennart Martens, and Kay Nieselt
Journal of Proteome Research 2025 24 (2), 919-928. DOI:
10.1021/acs.jproteome.4c00679